Data and Observations
Table 1
Lawn Soil Trial Data
Lawn Soil Trial Data
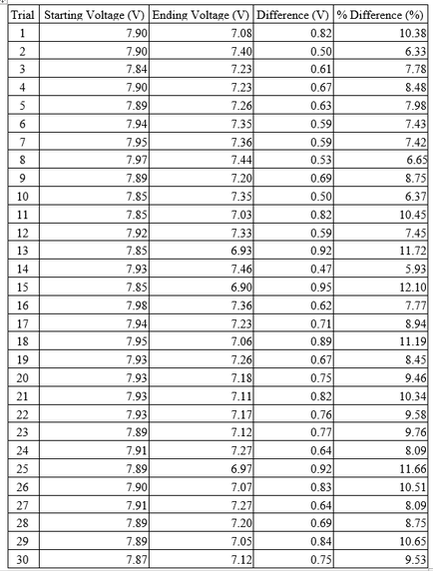
Table 1 shows the results of the lawn soil trials. Starting Voltage is the voltage recorded before the soil was distributed and Ending Voltage is the recorded voltage after the soil was distributed. The Difference column shows the difference between the Starting and Ending voltages and the % Difference column is the Difference divided by the Starting Voltage. A sample calculation is shown in Appendix A.
Table 2
Sand Trial Data
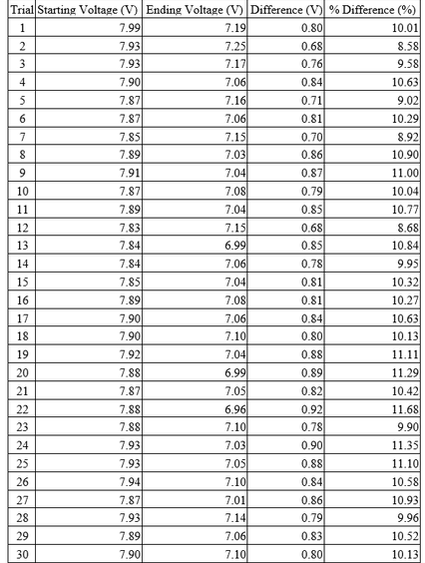
Table 2 shows the results of the sand trials. Starting Voltage is the voltage recorded before the sand was distributed and Ending Voltage is the recorded voltage after the sand was distributed. The Difference column shows the difference between the Starting and Ending Voltages and the % Difference column is the Difference divided by the Starting Voltage. A sample calculation is shown in Appendix A.
Table 3
Salt Trial Data
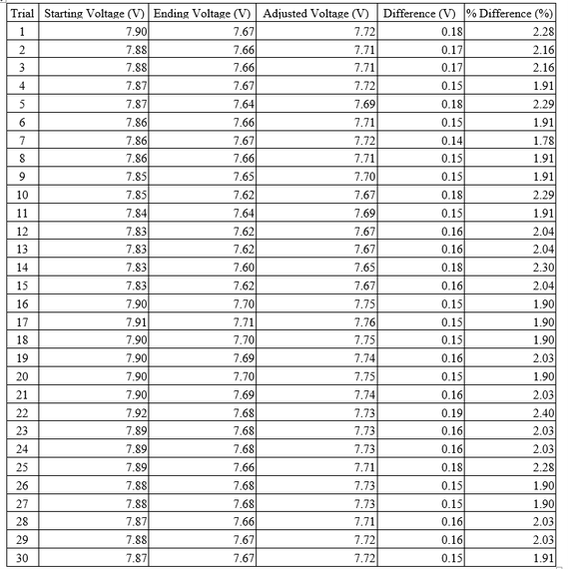
Table 3 shows the results of the salt trials. Starting Voltage is the voltage recorded before the salt was distributed and Ending Voltage is the recorded voltage after the salt was distributed. The Adjusted Voltage accounts for the saran wrap being on the solar panel by adding the difference the saran wrap made to the Ending Voltage. The Difference column shows the difference between the Starting and Adjusted Voltages and the % Difference column is the Difference divided by the Starting Voltage. Sample calculations are shown in Appendix A.
Table 4
Lawn Soil Trial Observations
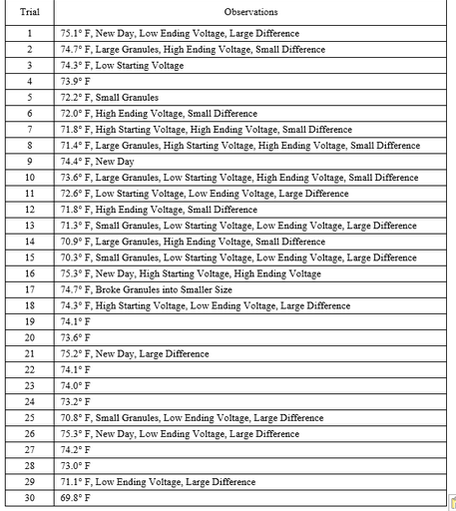
Table 4 shows the observations for the soil trials. The temperature and where each new day begins are given. The small or large granules were observations made of the soil when it was on the solar panel based on the size of the granules. The distribution process and the size of the granules could affect the outcome of the experiment. The observations also show which trials had a relatively low or high Starting or Ending Voltages and large or small difference between the Starting and Ending Voltages when compared to the averages of each category.
Table 5
Sand Trial Observations
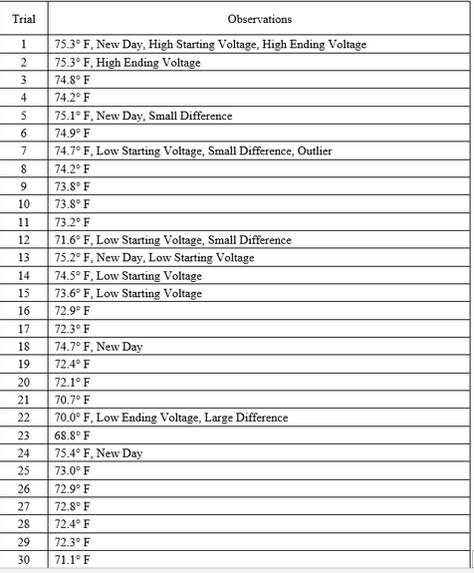
Table 5 shows the observations for the sand trials. The temperature and where each new day begins are given. No small or large granules were observed. The distribution process could affect the outcome of the experiment. The observations also show which trials had a relatively low or high Starting or Ending Voltages and large or small difference between the Starting and Ending Voltages when compared to the averages of each category.
Table 6
Salt Trial Observations
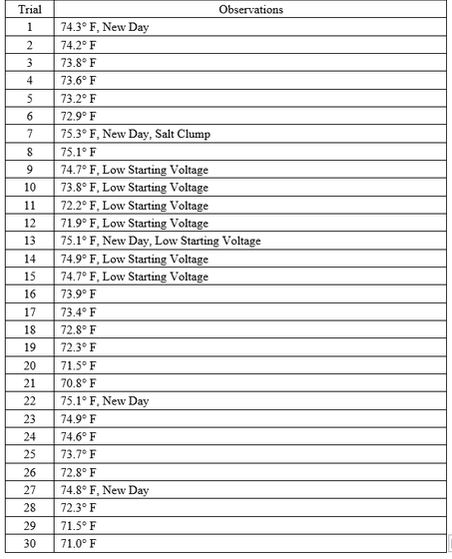
Table 6 shows the observations for the salt trials. The temperature and where each new day begins are given. No small or large granules were observed, however some of the salt water pooled together before it dried creating a salt clump. The distribution or drying process could affect the outcome of the experiment. The observations also show which trials had a relatively low Starting Voltages when compared to the average Starting Voltage.
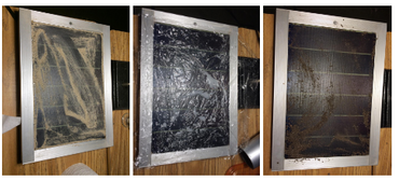
Figure 4. Ending Stage
Figure 4 shows the ending stage of a trial for each type of debris that was tested. The voltmeter read 7.17 V for the sand trial, 7.66 V for the salt trial, and 7.27 V for the soil trial. Each trials results varied due to the distribution of the debris, and the type of debris. Only the salt trials had saran wrap under them, which was accounted for in the percent difference and percent difference in Table 3.
Figure 4 shows the ending stage of a trial for each type of debris that was tested. The voltmeter read 7.17 V for the sand trial, 7.66 V for the salt trial, and 7.27 V for the soil trial. Each trials results varied due to the distribution of the debris, and the type of debris. Only the salt trials had saran wrap under them, which was accounted for in the percent difference and percent difference in Table 3.
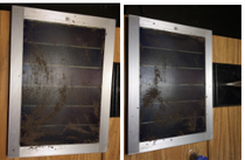
Figure 5. Comparison of Dirt Trials
Figure 5 shows two ending stages of lawn soil. The picture on the right shows that the granules of dirt are larger than those on the left. This may have caused a higher range of differences compared to the sand and salt trials.
Figure 5 shows two ending stages of lawn soil. The picture on the right shows that the granules of dirt are larger than those on the left. This may have caused a higher range of differences compared to the sand and salt trials.
