
Data Analysis and Interpretation
In order to test the reliability and validity of the data that was collected, it should be seen that the experiment had control variables, was randomized, and can be replicated. Each of these experimental aspects must be met to show the reliability of the collected data. The aspect of control allows for a consistent variable to compare with the data that is collected. Including randomization within the trials removes bias in performing the trials, and thus the data becomes more reliable when conducting a statistical test on it. The final aspect, replication, becomes essential to provide an order that can be followed to duplicate the experiment and a controlled procedure which can be followed to allow the experiment to be run smoothly and with accuracy. The control variable for this experiment was the type of debris that was used, being either dirt, sand, or a salt solution. The trials were randomized through use of the randomization function on a Ti-Nspire calculator. Additionally, dirt and sand trials were able to be done while waiting for the salt solution to become a film to be put on the solar panel. This may have furthered the randomization of the trials.
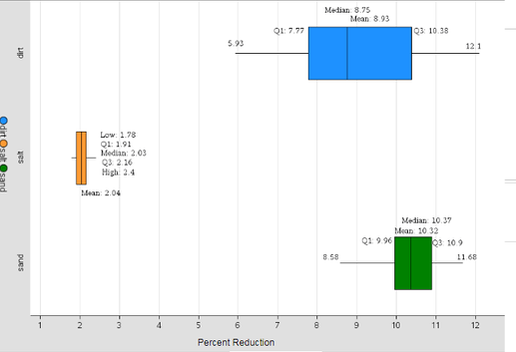
Figure 6. Box Plot Comparison of Debris Types
Figure 6, above, shows a boxplot of data for each of the three debris types that were tested in this experiment. The trials ran with dirt as the debris type show a large range in percent decreases of voltage output from the solar panel, ranging from 5.93% to 12.1%. There are no outliers in the sample of dirt trials, but the data does completely overlap the data of the sand trials, having a wider range of percent decreases. The trials that consisted of the salt solution as the debris type had a much lower decrease in voltage output, ranging from a 1.78% decrease to a 2.40% decrease, but also did not include any outliers. This data is completely separated from the data of the other two debris types, or, in other words, the boxplot of data does not overlap with that of either of the other debris types. The trials run with sand as the debris type have a range of 8.58% decrease to 11.68%, a range that is completely within and overlapped by the range of dirt trials. The spread of each box plot allows for comparison of each debris type’s data. It is clear that the salt solution had very little effect on the reduction in voltage of the solar panel, and should a two-sample t test need to be carried out, the salt solution would not need to be included because of this. Therefore, the only variables that need to be compared are dirt and sand. To determine which of these had the greater mean effect percent reduction on the solar panel voltage, a two-sample t test comparing the means of each population was conducted.
To complete a two-sample t test, three conditions must be met. The first of which states that each of the two sample means must be a simple random sample. This assumption is met by the randomization processes used in determining when to do each trial, and which trials would be conducted. The second of these is that each of the samples follow a normal probability distribution. Both the dirt sample population and sand sample population have an equal number of data points and fit a normal probability bell-shaped curve, this assumption is met. The third and final assumption is that each of the sample populations have the same standard deviation. This is not true, however the test can still be carried out as the Central Limit Theorem states that this assumption can be met so long as the sample populations are of 30 or more points. Each population being tested had 30 points. The null hypothesis for this test, Ho, states that both the mean percent reduction for sand and dirt are equal, μdirt = μsand. The alternative hypothesis, Ha, is that the mean percent reduction for sand is higher than that of dirt, μdirt < μsand. A sample calculation can be found in Appendix A.
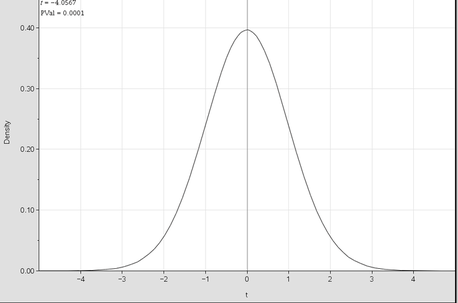
Figure 7. Bell Curve of t-test Between Dirt and Sand
Figure 7 shows the bell-curve of the data used for the t-test. The p-value matches that of the t test. Since the data fits the bell curve, it can be said that his assumption is met and the t test can be conducted.
Table 7
Two-Sample t Test Results
Figure 7 shows the bell-curve of the data used for the t-test. The p-value matches that of the t test. Since the data fits the bell curve, it can be said that his assumption is met and the t test can be conducted.
Table 7
Two-Sample t Test Results
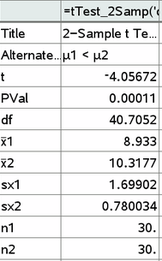
Table 7, above, shows the results of the two-sample t test. As can be seen, the p-value is smaller than the alpha level value of 0.05, meaning that Ho is rejected. There is evidence that the true population mean of the sand population is greater than the true population mean of the dirt population. If Ho were true, these results would occur nearly 0% of the time (0.011%).
The results of the two-sample t test show that the means of the sand and dirt data sets are not equal, and that the mean of the sand data set is higher than that of the dirt. Thus, it can be concluded that the sand had the highest effect on the power reduction of the solar panel, with the greatest mean power reduction percentage, 10.32%, to match. The salt solution was shown to have little effect on the power reduction, and did not overlap with the data sets of either dirt or sand, and thus did not need to be tested in order to be concluded that it had the least effect. This means that the original hypothesis, that sand has the greatest effect on the solar panel power reduction, and the salt solution has the least, can be accepted.
