Conclusion
The purpose and design of this experiment was to determine which type of debris; soil, sand, or salt, had the greatest effect on the voltage output of a solar panel. The dirt had a range of 5.93% power reduction to 12.1% power reduction, with the mean being at 8.93% power reduction, the second largest mean of the three debris types. The sand had a range of 8.58% to 11.68% power reduction, along with the highest mean power reduction percentage at 10.32%. The salt solution had the smallest range of power reduction, 1.78% to 2.4%, and the lowest mean power reduction at 2.03%. Due to the salt solution having such a low mean, and having no overlap with the other two data sets, it was not used in the two-sample t test and was concluded to have the least effect on the power reduction of the solar panel. Based on the statistical two-sample t test that was used, it was found that the sand had the greatest effect on power reduction and the salt solution had the least effect on the power reduction of the solar panel. This was determined by the p-value of the t-test being less than the alpha level value of 0.05. This means that the null hypothesis (Ho: μdirt = μsand), stating that the means of the dirt and sand data populations are equal, is rejected, and that the alternative hypothesis (Ha: μdirt < μsand), stating that the true population mean for the sand data is greater than the true population mean of the dirt data, fails to be rejected. The original hypothesis, that sand would have the greatest effect and the salt solution would have the least effect, is accepted.
Given the data collected and the statistical tests that were run, it can be concluded that the sand had the greatest effect on the power reduction of the solar panels, while dirt had the second greatest effect, and salt having the least effect. While the data shows a complete overlap of the sand data by that of the dirt (Figure 6), the mean of the sand data (10.32) was proven by the statistical test to be higher than that of the data collected from dirt trials (8.75), and thus the sand is said to have a greater effect than the dirt. The salt solution did not overlap data from either of the other two sets (dirt and sand), and thus was easily shown to have the weakest effect on the power output of the solar panel. These results can be explained scientifically based on the properties of each debris type used. The salt solution is unable to do any more than reflect the photons of light, while the dirt can absorb and re-emit the light. However, the sand is able to do all three; reflect, absorb, and re-emit, the photons of light, making it able to keep the most light from being used as power by the solar panel. Based on this experiment, it would be a better idea to install a solar panel in an area in which sand is not a common type of debris. Examples of this include suburbs and communities that are not close to shorelines or areas covered in sand, such as deserts. Even so, one should expect some voltage reduction regardless of where the solar panel is installed, due to the numerous aerosols in the air. Debris may pile on, and begin to reduce the solar panel’s usefulness if not cleaned correctly.
The results could be attributed to the types of debris that were placed on the solar panel. Soil absorbs more photons of light than either of the other two types of debris, allowing less of the light to get through to the solar panel, and thus it would make sense that the soil would have a greater percent reduction in the voltage output in the solar panel. However, this was not the case as this experiment concluded, because while the soil absorbs the sunlight, the sand and salt reflect light back into the atmosphere as theorized by the paper, “Aerosols: Tiny Particles, Big Impact, by Adam Voiland”.
These results agree with current work in the field. The voltage output decreased when debris was added to it. This agrees with the work, “Solar Cells Performance Reduction under the Effect of Dust in Jazan Region” by Rachid Karmouch and Effects of Dust on the Performance of PV Panels by Shaharin A Sulaiman. In Karmouch’s experiment, a reduction of 10.4% in the voltage output of the solar panel was found when the solar panel was tilted 30° and a reduction of 9.7% when the solar panel was tilted 55°. While the experiments had different goals, and this experiment did not have a tilted solar panel, the result of a reduction in the amount of voltage output is similar. In Sulaiman’s experiment the voltage output of a photovoltaic solar panel was, on average, 18% when artificial dust was placed on a plastic sheet on the solar panel. This happens because when aerosols such as sand, salt, soil, or dust get in between photons of light and the solar panel, the light is reflected and cannot reach the solar panel, therefore reducing the voltage output.
This experiment is feasible because other research shows that keeping the solar panel in a controlled environment and keeping the temperature similar were important to reducing error in an experiment. However, there was some error in the experiment due to the saran wrap, temperature fluctuation, size of the granules of debris, and the distribution method. The Saran Wrap created a different ending voltage compared to if the salt alone had been applied. Thus a calculation had to be made to account for that error. This was the Adjusted Voltage and a sample calculation can be found in Appendix A. While the temperature did not increase over the course of a day as it did in Min Cui’s experiment, Thermal Test and Analysis of Concentrator Solar Cells, it did decrease. This was due to the storage method. The locker that the solar panel was stored it had a higher room temperature than the basement the experiment was conducted in. All of these errors should have had a minimal effect on the outcome of the experiment due to the number of trials done. The size and distribution of the debris would have had a greater effect on the outcome of the experiment. There was no uniform distribution over the course of the experiment. Researchers moved debris around according to how they saw fit to cover the entire solar panel and the experimenter bias could have affected the trials.The size of the debris mattered because if there were larger granules there would be less to spread out to cover the entire solar panel.
To further knowledge in the interaction between debris and solar panels, other types of debris could be tested at higher amounts, or an interaction between two or more types of debris could be done. This would be more realistic because the chances of only a single type of debris being present on a solar panel, as it was in this experiment, is unlikely. A further advancement to this research is seeing if different color solar panels will produce more or less voltage. Depending on the color, light could be absorbed or reflected more. This would enhance knowledge about where solar panels should be positioned and what they should be made up of. Finally, one might also want to test the temperature of the solar panel as well, both with and without debris, as this could further the decision on where to place the solar panel, as well as how effective the solar panel is under different weather and temperature circumstances.
Appendix A: Sample Calculations
D=Sv-Ev D=7.90-7.10=0.80
D=Sv-Av D=7.90-7.72=0.18
Figure 8. Sample Calculation of Difference
These are sample calculations of the Difference. Difference is represented by D, Starting Voltage is represented by Sv, Ending Voltage by Ev, and Adjusted Voltage by Av. The calculation on the top is last trial of Table 2 and is representative of the sand and soil trials. The Difference for these trials is the Starting Voltage subtracted by the Ending Voltage. The calculation on the bottom is first trial of Table 3 and is representative of the salt trials. The Difference for these trials is the Starting Voltage subtracted by the Adjusted Voltage.
% Difference=(( Sv - Ev ) / Sv )*100 % Difference=(( 7.99 - 7.19) / 7.99)*100= 10.01%
Figure 9. Sample Calculation of % Difference
Figure 9 shows the equation used to determine the percent difference in voltage output as well as a sample calculation. The percent difference was determined by subtracting the ending voltage, Ev, from the starting voltage, Sv, and dividing the result by the starting voltage, then multiplying by 100.
Av=Ev+0.05 v=7.67+0.05=7.72
Figure 10. Sample Calculation of Adjusted Voltage
This is a sample calculation of the Adjusted Voltage in the first salt trial in Table 3. Adjusted Voltage is represented by Av , and Ending Voltage is represented by Ev. The Adjusted Voltage was calculated by adding 0.05 to the Ending Voltage.
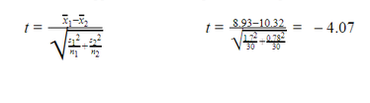
Figure 11. Sample Calculation of Two-Sample t test
Figure 11, shown above, gives the equation for determining the t value of a two- sample t test and a sample calculation. The t value, represented as t, is equal to the mean of the first population, x-bar1, minus the mean of the second population, x-bar2, divided by the square root of the first population’s standard deviation squared, s12, over the size of the population, n1, plus the standard deviation of the second population squared, s22, over the size of the second population, n2.
Figure 11, shown above, gives the equation for determining the t value of a two- sample t test and a sample calculation. The t value, represented as t, is equal to the mean of the first population, x-bar1, minus the mean of the second population, x-bar2, divided by the square root of the first population’s standard deviation squared, s12, over the size of the population, n1, plus the standard deviation of the second population squared, s22, over the size of the second population, n2.
Appendix B: Conversation With Wesley Anderson
Hello, Mr. Anderson, my name is Jocelyn and my partner Matt and I are working on a senior research project for physics. Knowing that you majored in physics at Hope College, we were wondering if you would be able to help us solve some problems that we have encountered while creating a procedure for our experiment.
Sure, could you explain the experiment to me?
In this experiment we are comparing the effects different types of debris such as sand, sea salt, and lawn soil, have on the voltage output of photovoltaic solar panels. To do this we are placing 5 mL of each type of debris on a solar panel, one at a time and recording the difference to do a two-sample t-test to compare the means of each type of data later. However, we have stumbled upon a problem. We need to create a film of salt on the solar panel, and to do so we are dissolving sea salt in water and using a hair dryer to evaporate the water, leaving only a film of sea salt behind. The problem surfaces when we are trying to evaporate the water. It takes to long to do and the solar panel becomes incredibly hot, which will reduce its efficacy. We were wondering if you could help us come up with a way to get a film of salt water on the solar panel.
Are you using sea salt or table salt for this experiment?
We are using sea salt because it would replicate the conditions of a marine biome better than that of table salt.
There is no difference between table salt and sea salt. However, the grains in sea salt are larger than those in table salt, so it would be easier to dissolve the table salt in hot water. To fix the problem with evaporation, I would suggest creating the salt film on a piece of glass or something that allows light to reach the solar panel and evaporating the water through the use of a microwave or oven. Anything else?
That is all the questions we have for right now. We were wondering if you would be willing to answers more questions for us as they arise over the course of our experiment?
Of course, feel free to call anytime.
Thank you and have a wonderful evening!
You too, bye.
Bye.
Works Cited
Anderson, Wesley. Phone Conversation. 1 November 2017.
“Cleaning Your Solar Panels.” Evergreen Solar, National Council for Solar Growth, 2017. evergreensolar.com/how/cleaning/.
Crabtree, George W., and Nathan S. Lewis. “Solar Energy Conversion.” Caltech.edu, Physics Today, Mar. 2007,
authors.library.caltech.edu/7721/1/CRApt07.pdf.
Cui, Min, et al. “Thermal Test and Analysis of Concentrator SolarCells.”Www.spiedigitallibrary.org, SPIEDigitalLibrary, 4 Jan. 2008,
file:///C:/Users/Warren/Downloads/684117.pdf.
Karmouch, Rachid. “Solar Cells Performance Reduction under the Effect of Dust in Jazan Region.”OMICS International, OMICS
International, 26 Mar. 2017, www.omicsonline.org/open-access/solar-cells-performance-reduction-under-the-effect-of-
dust-in-jazan-region-2090-4541-1000228.php?aid=86803.
Dhar, Michael. “How Do Solar Panels Work?” LiveScience, LiveScience, 16 Dec. 2013, www.livescience.com/41995-how-do-solar-
panels-work.html.
Pickerel, Kelly. “Fighting Dirty: Manual Washing vs. Automatic Cleaning of Solar Modules.”Solar Power World, 23 Feb. 2015,
www.solarpowerworldonline.com/2015/02/fighting-dirty-manual-washing-vs-automatic-cleaning-of-solar-modules/.
“Solar Panels Just Broke Another Record in the U.S.” Fortune, fortune.com/2015/09/09/solar-panel-record-america/.
http://fortune.com/2015/09/09/solar-panel-record-america/
“Solar Panel Maintenance.” The Solar Company, www.thesolarco.com/solar-energy/solar-panels/solar-panel-maintenance/.
Sulaiman, Shaharin A., et al. “Effects of Dust on the Performance of PV Panels.” Waset.org, World Academy of Science,
Engineering and Technology, 10 Nov. 2011,
waset.org/publications/10305/effects-of-dust-on-the-performance-of-pv-panels.
Voiland, Adam. “Aerosols: Tiny Particles, Big Impact.” Nasa.gov, Earth Observatory, 2 Nov. 2010,
earthobservatory.nasa.gov/Features/Aerosols/.
